
Gears
Case Study: Gear damages
There are many possible causes for gearing damages and numerous methods to identify them. Depending on the failure mechanism, a visual inspection of the gears and bearings can be sufficient. In other cases, the material’s hardness, chemical composition and cleanliness hold the answers. Finally, numerical simulations of the system can give insight into contact patterns and loading behaviors in different load conditions. A synthesis of all of these approaches can be necessary to reach a plausible hypothesis.
Background
A customer experienced repeated failure of the second stage in a gearbox for an agricultural application. The damage was consistent across several gearboxes and occurred after a relatively low number of operating hours. Hardness measurements and examinations looking for superficial crack formation and grinding burns were inconclusive.
Elgeti Engineering received both damaged and undamaged gears along with the bearings from one shaft. A comprehensive analysis of all components was performed, including visual and material inspections and a simulation of the entire gearbox to evaluate the design. The synthesis of these different methods allowed the failure mechanism to be identified and a counter-measure recommended to the customer.
2 Visual Inspection
2.1 Damaged Gear
Several damaged gears were received. The most obvious damage was one to two broken teeth due to fatigue fractures. The cracks originated at the bottom of the loaded area of the flank, indicating the presence of high loads. This area of the tooth also experiences the greatest sliding movement which further increased the loads. The point of origin was only slightly eccentric, indicating that no significant misalignment was present (Figure 1). On the undamaged teeth, cracks were also beginning to develop in the same area (Figure 2).
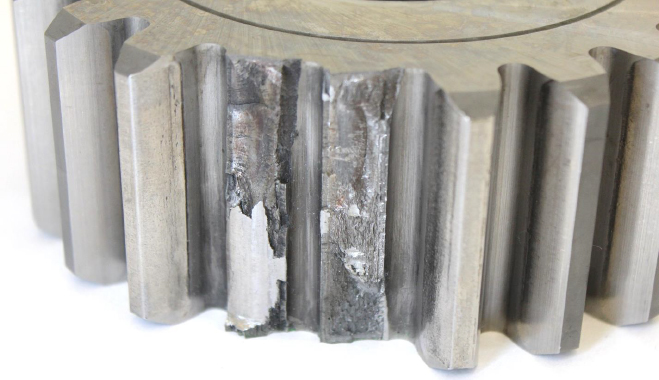
Figure 1: Damaged gear: crack initiation sites and plastic deformation at the edge of the contact areas.
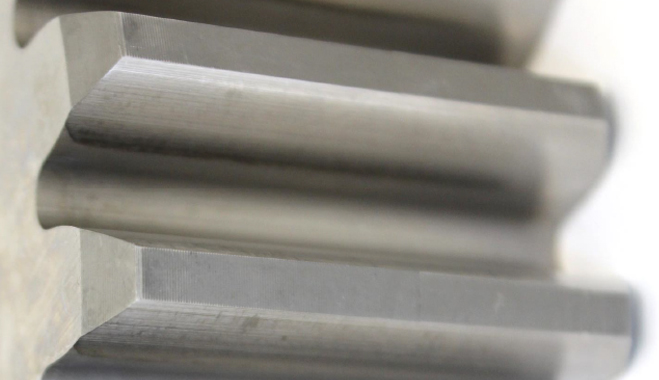
Figure 2: Teeth on undamaged gear: crack development at the end of the contact area, edge at the start of the tip relief.
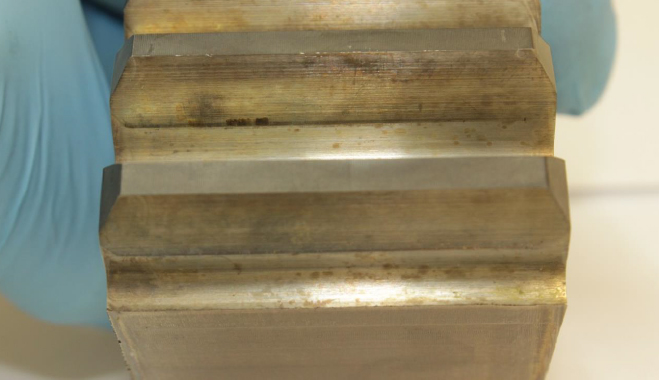
Figure 3: Gear with remnants of nital etching; darker discolorations in the contact area not indicative of grinding burns.
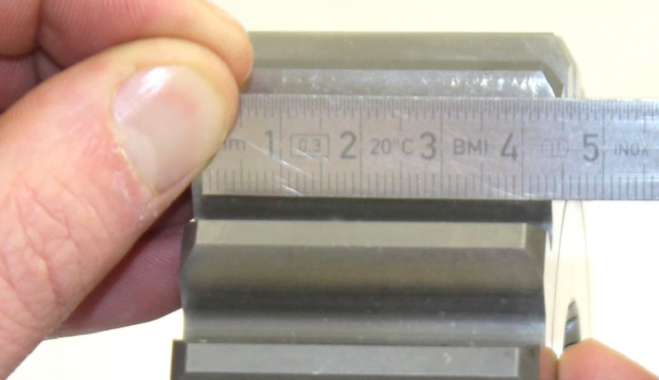
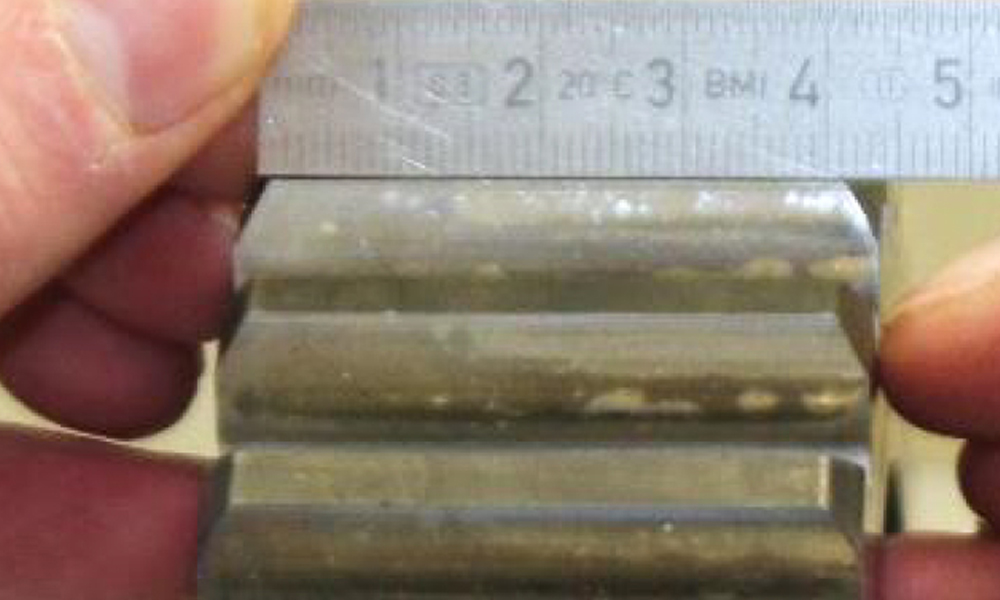
Figure 4: Width of the contact area in area of failure initiation, unbroken tooth: approximately 41.5 mm.
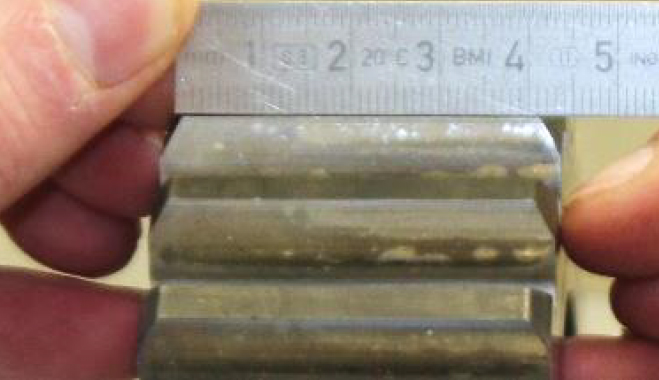
Figure 5: Width of the edge at the start of the tip relief, approximately 41.5 mm.
The loaded areas have been darked due to remnants of previously conducted nital etching (Figure 3). This discoloration can be attributed to near-surface structural modifications caused by high loads rather than to grinding burns.
The contact area itself ends abruptly. The width of the contact area at the root corresponds to the width of the meshing gear at the beginning of the tip relief (Figure 4 and Figure 5). The transition to the tip relief is clearly visible on all teeth and this sudden change increases pressure locally.
2.2 Undamaged Gears
The same beginning wear at the tooth roots and tip relief transition as well as the abruptness of the transition itself were also present on the undamaged gears (Figure 6 and Figure 7). The contact pattern itself also appeared slightly eccentric.
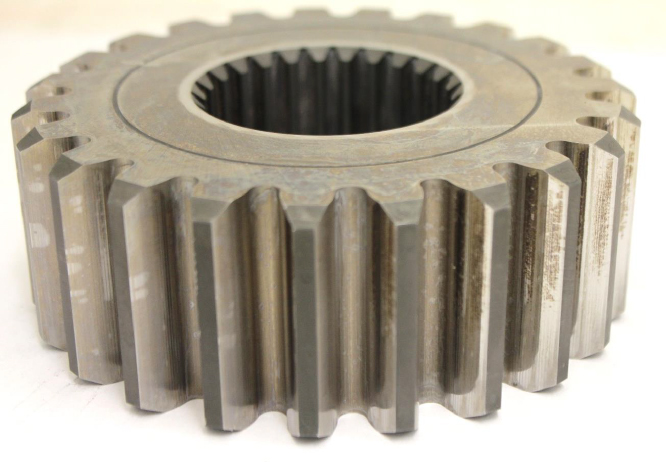
Figure 6: Undamaged gear: slightly eccentric contact pattern, beginning wear near bottom edge of contact area.
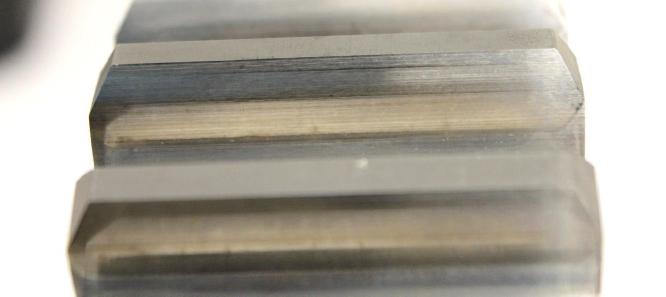
Figure 7: Undamaged gear: beginning wear near the bottom edge of the contact area and edge at the transition to tip relief.
2.3 Bearings
The tapered roller bearings from the two related shafts from undamaged gearboxes were examined. Eccentric damage to gears can be caused when tapered roller bearings are mounted with play instead of preload, which occurs relatively easily during manual installation. However, the appearance of the raceways was consistent with the presence of an axial load (Figure 8). Installation with play rather than preload could therefore be excluded. No damage was found on the bearings and the discoloration on the rollers is consistent with normal tribological reaction layers (Figure 9).
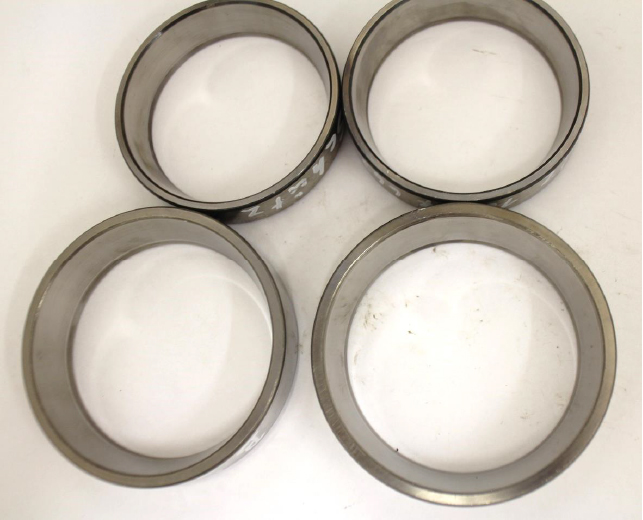
Figure 8: Outer rings of bearings from the related shafts: regular tracks on the raceways indicative of axial loading.
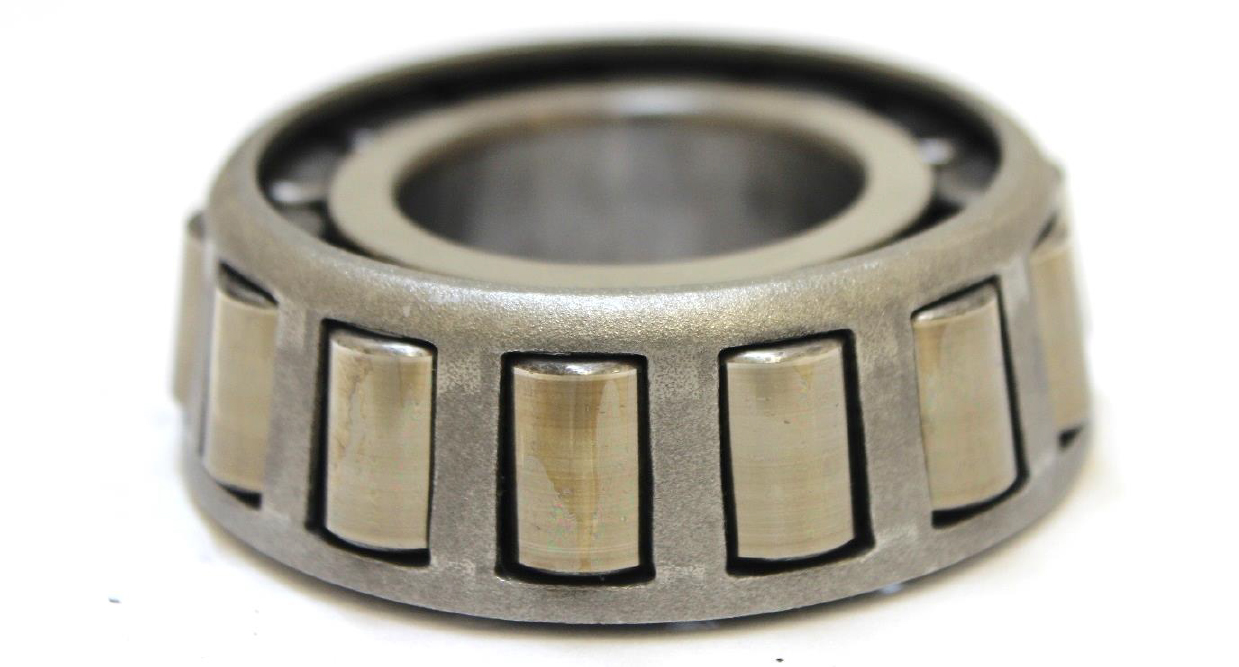
Figure 9: Rollers of one of the bearings, no findings.
3 Material Inspection
3.1 Hardness
The Vickers hardness of the gear (HV0,1 and HV1) was measured. Figures 10 and 11 show the results. The hardening depth is therefore 2,4 mm according to HV1.
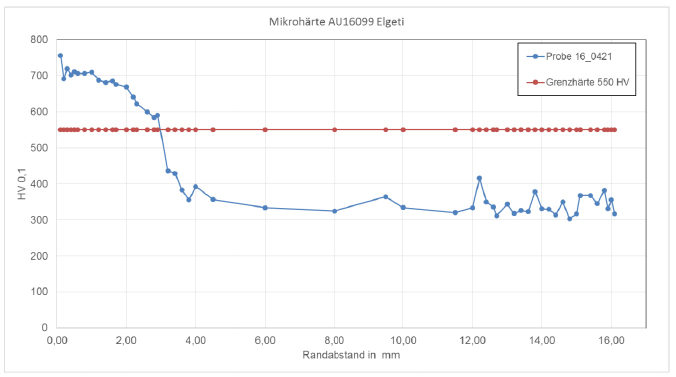
Figure 10: Hardness measurement HV0,1
The core hardness was also measured according to HV10. The results (with 323 HV being the median) are shown in Table 1. Overall, the heat treatment corresponds to the specification in the drawing.
3.2 Chemical Composition
A sample was subjected to radio spectral analysis and the results then compared to the standard values of the material. The results showed that the composition was nearly identical to that of 18CrNiMo-7-6 with a slightly elevated level of chromium (Table 2).
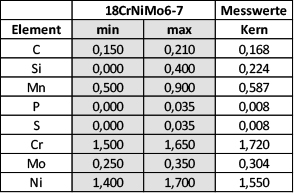
Table 2: Comparison of sample composition with standard values of the material.
3.3 Material inspection
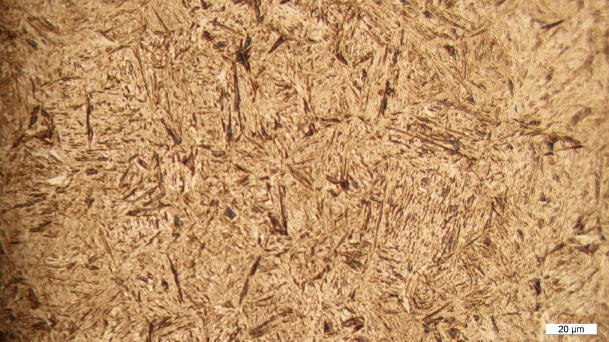
A material inspection was conducted on a sample. Overall, the tempered microstructure was highly pure andregular (Figure 12). The base structure was bainitic (Figure 13) with a martensitic carburized edgemicrostructure (Figure 14). There was no indication of grinding burns or new areas of hardening.
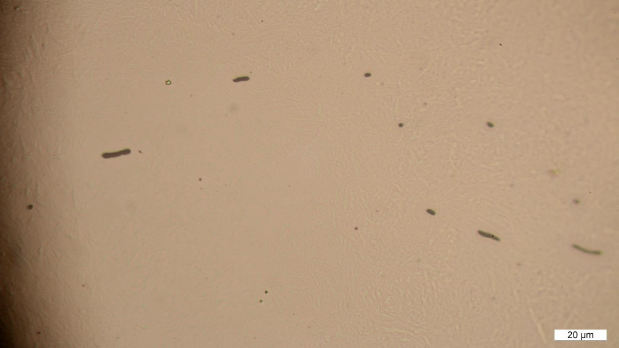
Figure 12: Only small manganese sulphide inclusions.
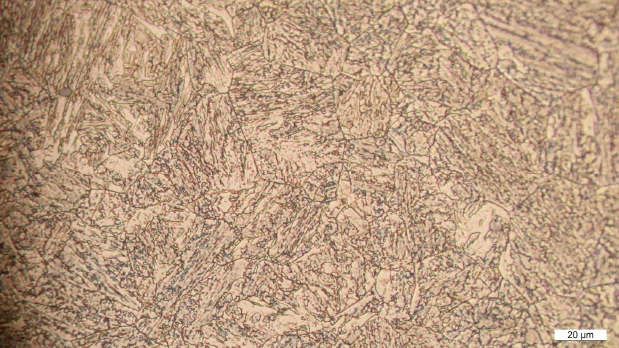
Figure 13: Bainitic base microstructure.
3.4 Grain size determination
According to DIN 3990, the highest material quality ME requires grain size numbers G between 5 and 8 as determined by the now defunct DIN 50601. Comparable results can be obtained from DIN EN ISO 643, as applied here.The structure was very fine with hardly any remaining austentite. An evaluation was performed using the lineer-intercept method in a few representative areas. According to the standard, a magnification must be chosen such that there exist at least 50 intersections between the line and grains. However, in this case the grain boundaries only became visible at 400x magnification, so the number of intersections is smaller than that required by the standard and the evaluation is valid for a smaller section of the sample.The resulting G number is 7 (Table 3), qualifying the material as ME grade.
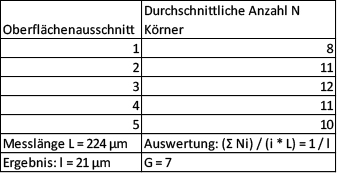
Table 3: Grain size evaluation.
3.5 Determination of cleanliness
According to DIN 3990, the highest material quality ME requires coefficients of K1 ≤ 20, K2 ≤ 5 and K3 ≈ 0. These factors are determined according to the new defunct standard DIN 50602 in consideration of the total number of inclusions of a specific size factor multiplied with a weighting factor f scaled to a sample area of 1000mm2. Here, the full surface was examined due to its relatively small size. The results are tabulated (Table 4) and the material accordingly qualified as ME grade.

Table 4: Tabulation of inclusions for evaluation.
4 Design Verification / Calculation
The complete gearbox was modelled using the FVA Workbench. The manufacturer provided all drawings, specifications, and a CAD model of the housing. The Workbench allows the entire gearbox to be regarded as a system, including all of the appropriate stiffnesses due to the housing, bearings, shafts, and other stages. The model’s response to several different load cases was calculated, including nominal loading in first and second gear, maximum drive forwards, and an abrupt stop.The results depicted in Figures 15 through 17 show well-utilized flanks. It is only in the extreme load case scenario that there is an eccentric contact pattern. Higher pressure is present in the middle section of the flanks, corresponding to the transition between one and two teeth being loaded ‚Äì i.e. there is an uneven overlap ratio.Although the overall safety against flank fatigue is smaller than 1.0, the area of peak pressure does not correspond to the origin of the failure. The root cause must therefore be found elsewhere.As previously mentioned, the tip relief of the pinions end in a sharp edge and the point of damage corresponds to the location where this edge comes into contact with the wheel. Measured data indicates that the radius amounts to values between 1 and 2 mm. Figure 18 shows the influence of such an edge as a function of its radius based on the nominal load and Hertzian Theory. It is clear that the resulting surface pressure can exceed the nominal pressure by several factors, meaning that the results of the simulation can hardly describe the conditions in this specific area.
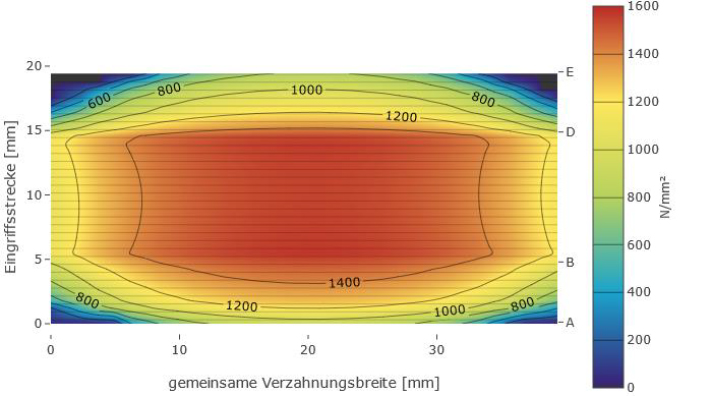
Figure 15: Load case 2, nominal load in second gear
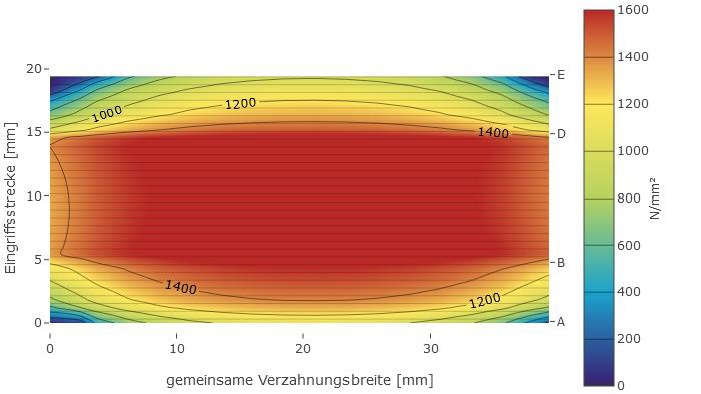
Figure 16: Load case 3, maximum load in second gear: slight eccentricity in the pressure peak beginning to develop.
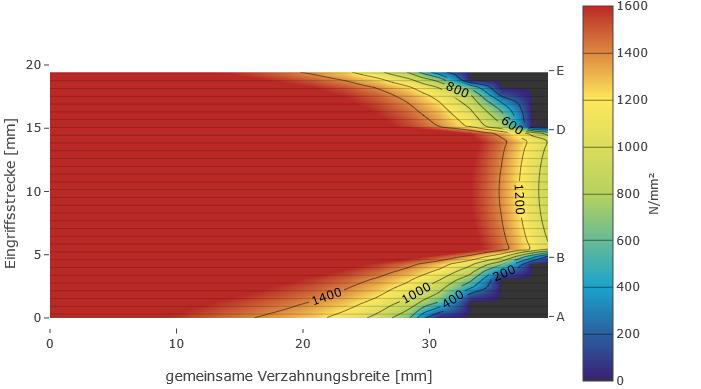
Figure 17: Load case 4, abrupt stop.
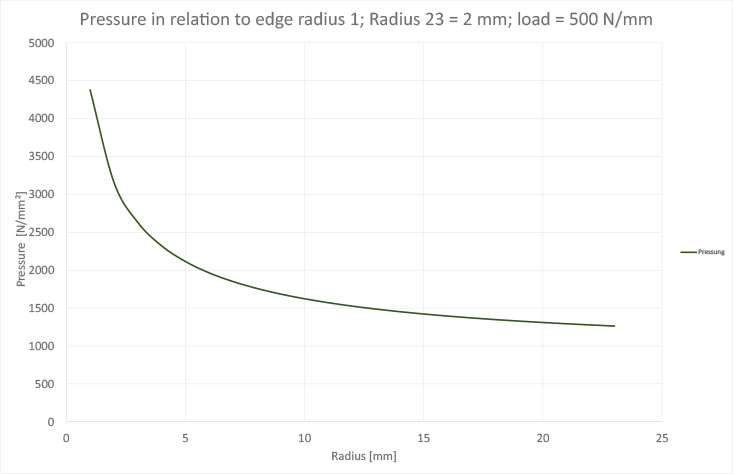
Figure 18: influence of edge radius
5 Summary & Conclusion
The material was found to be of the correct chemical composition and have a high degree of cleanliness while the heat treatment corresponds to drawing specification. Numerical simulation indicates a lack of safety against flank fatigue; however, visual inspection shows crack origins in a different area to where maximum stresses are expected. Furthermore, grinding burns and improper bearing arrangement could be excluded.
Visual inspection showed the existence of a sharp edge where the pinion modification begins. It can be shown that such edges are likely to multiply the local pressure and failures are therefore likely to begin right where this edge hits the flanks. Subsequently, one must conclude that the failures can be traced back to either improper manufacturing or the lack of a smooth transition between the modified and unmodified flank areas.
Source: www.elgeti-engineering.de/en


-
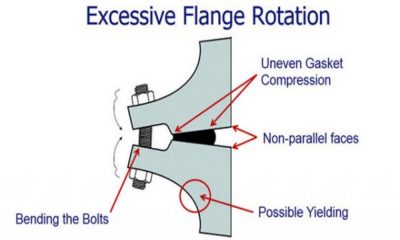
 Industrial Hardware and Machine Parts9 years ago
The necessity of bolted flange connection training
-
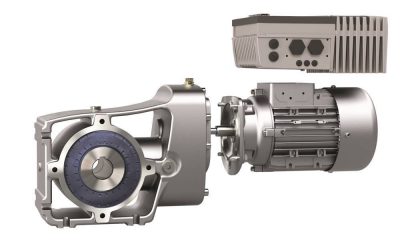
 Drive systems6 years ago
Intelligent frequency inverters for digital production
-

 Motors9 years ago
New generation of hollow shaft motors
-

 Industrial Hardware and Machine Parts8 years ago
ABB and Formula E partner to write the future of e-mobility
-
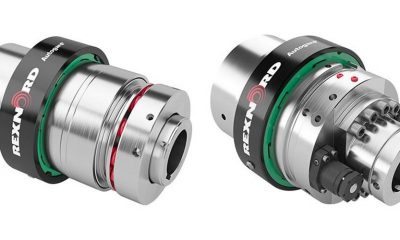
 Industrial Hardware and Machine Parts8 years ago
Rexnord adds to its Autogard Torque Limiters with the XG Series
-

 Motors9 years ago
ZF Technology on the Winners’ Podium of the Dakar Rally 2017
-
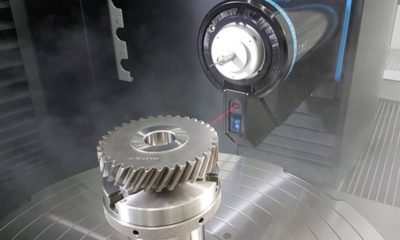
 Gear drives8 years ago
Klingelnberg at control 2018: Tactile and optical measurement on one machine
-
 Motors9 years ago
Get a first-class ticket to productivity
-

 POWER TRANSMISSION TECHNOLOGIES5 years ago
EUROTRANS Board meets for its first session in 2021
-

 Motion control8 years ago
Where the robots come from?
-
 Motion control8 years ago
Rexnord to Acquire Centa Power Transmission
-
 Industrial Hardware and Machine Parts9 years ago
Custom hobbing tool enables 45-degree angles